
Key Takeaways
-
SEO reporting dashboards turn overwhelming data into simple, actionable insights, helping your team or business make strategic decisions faster and more informed.
-
By contextualizing and visualizing the SEO data, you’ll align your reporting with your business goals and get stakeholders to understand the story beyond the numbers.
-
By setting goals and tracking key metrics, including traffic sources, keyword performance, and technical health, you can get a full picture of website performance.
-
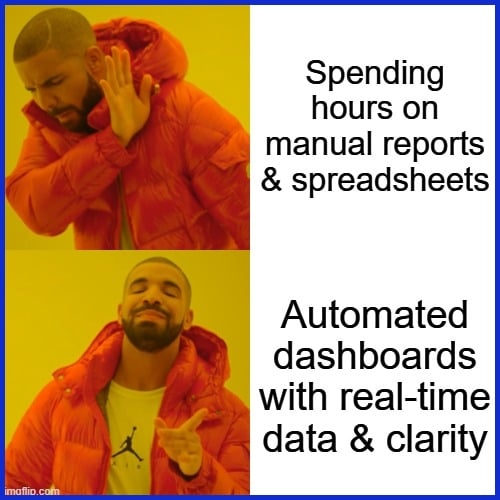
Automating data collection and updates simplifies reporting, freeing up your team’s time and eliminating manual labor so they can focus on impactful SEO activities.
-
By designing dashboards with intuitive layouts, appropriate visualizations, and audience-centric content, you bring greater engagement and utility for diverse stakeholders.
-
By combining multiple data sources and leveraging advanced analytics, e.g. predictive insights and anomaly detection, teams can stay proactive and iterate on SEO strategies.
Running SEO for a small business can feel overwhelming—rankings, traffic, backlinks, conversions, and endless spreadsheets competing for attention. That’s where SEO reporting dashboards come in. These tools pull all your key metrics into one place, giving you a clear, real-time view of how your campaigns are performing.
Instead of juggling multiple reports or second-guessing data, a well-designed dashboard shows exactly what’s working, what needs attention, and where to focus next. For small businesses, especially, this clarity saves time, cuts out confusion, and makes every marketing decision more confident.
In this article, we’ll explore the essential features of an effective SEO dashboard, highlight affordable options that actually work, and show you how to use them to drive smarter results.
Top 10 Affordable SEO Reporting Dashboards for Small Businesses
1. KPI.me
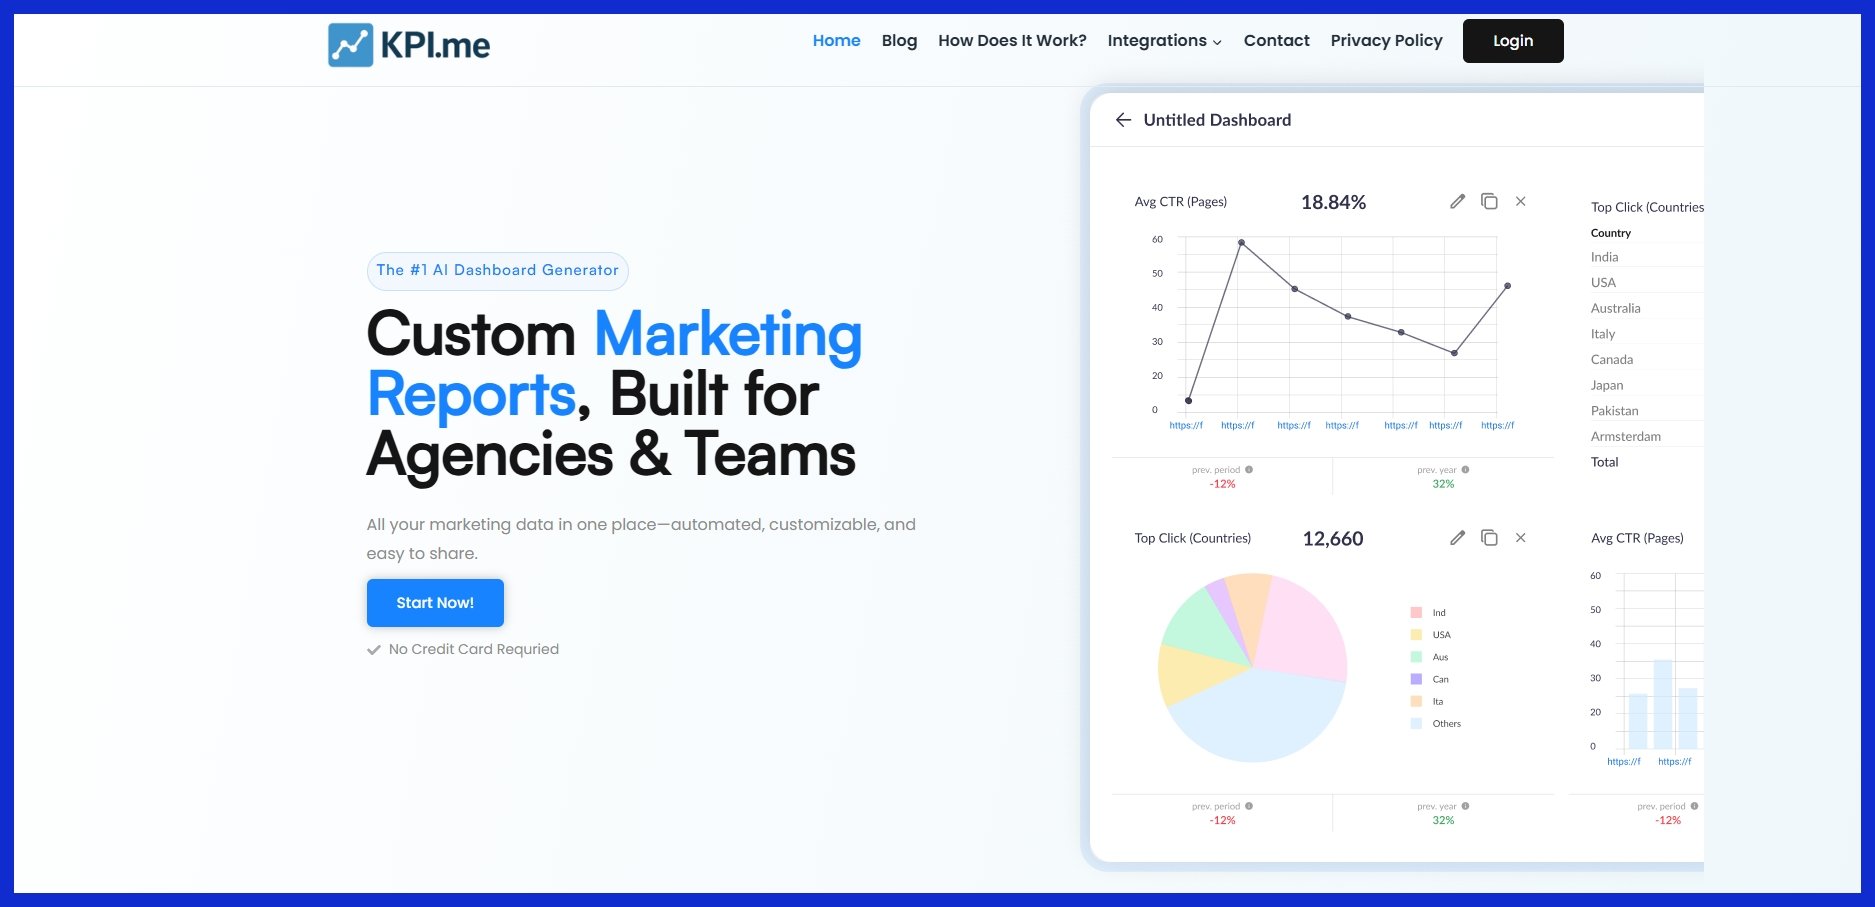
Best for: Agencies and teams that want branded, client-ready dashboards fast.
What it does: Consolidates GA/GSC and other SEO metrics into real-time, white-labeled dashboards (custom domain, logo, colors). Includes handy KPI widgets and simple sharing.
Pros: True white-label, clean UI, quick setup, real-time updates, easy report sharing. Free to start.
Cons: Newer ecosystem (fewer niche integrations than older tools); some advanced features still rolling out.
Pricing: Free tier available; paid plans are flat, affordable, and not charged per client.
2. Google Looker Studio (formerly Data Studio)
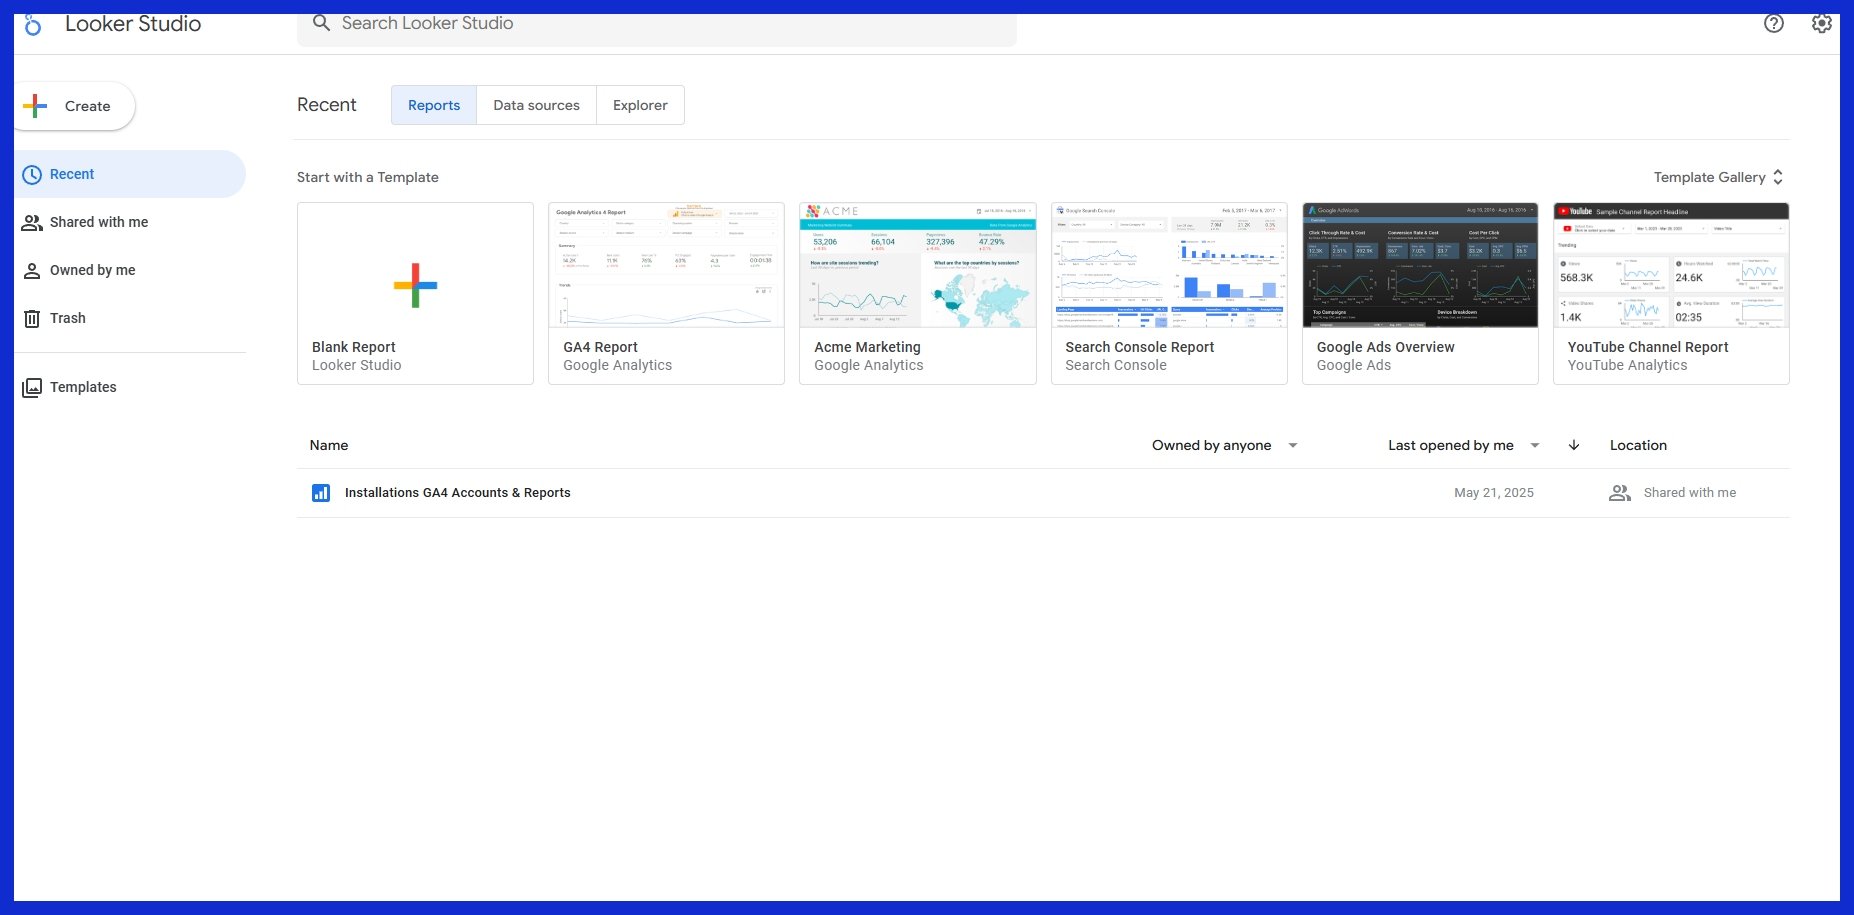
Best for: Maximum flexibility at zero cost.
What it does: Builds custom SEO dashboards using data from Google Analytics, Search Console, Sheets, and many other sources.
Pros: Free, highly customizable, easy sharing/collaboration.
Cons: Limited white-labeling; non-Google connectors can be tricky; learning curve for beginners.
Pricing: Free (optional Pro add-ons are low-cost).
3. AgencyAnalytics
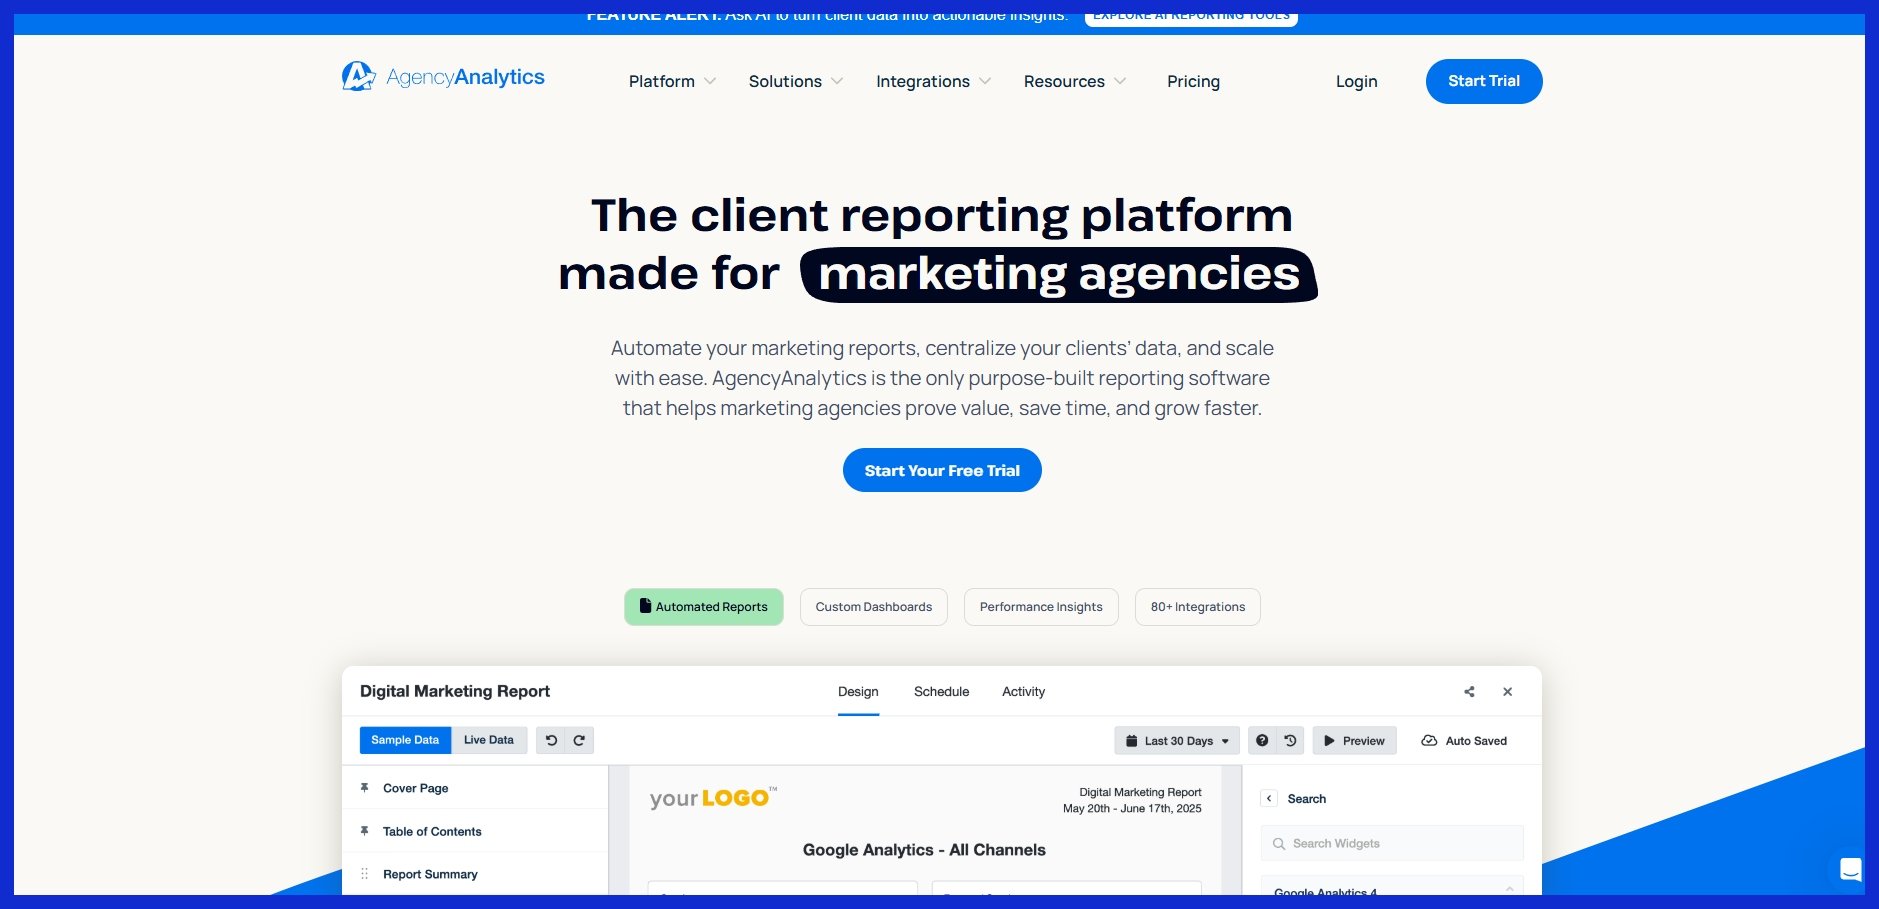
Best for: Agencies needing SEO + PPC + social in one place.
What it does: Pulls in 60+ integrations (GA, GSC, Ads, Ahrefs, etc.), with rank tracking, site audits, and automated reports.
Pros: Wide channel coverage, built-in SEO tools, automated reporting, client logins, white-label.
Cons: Per-campaign pricing can add up; customization/layout flexibility is more template-driven than BI-style tools.
Pricing: Starts around the mid-tier range per month; lower when billed annually (no free plan).
4. DashThis
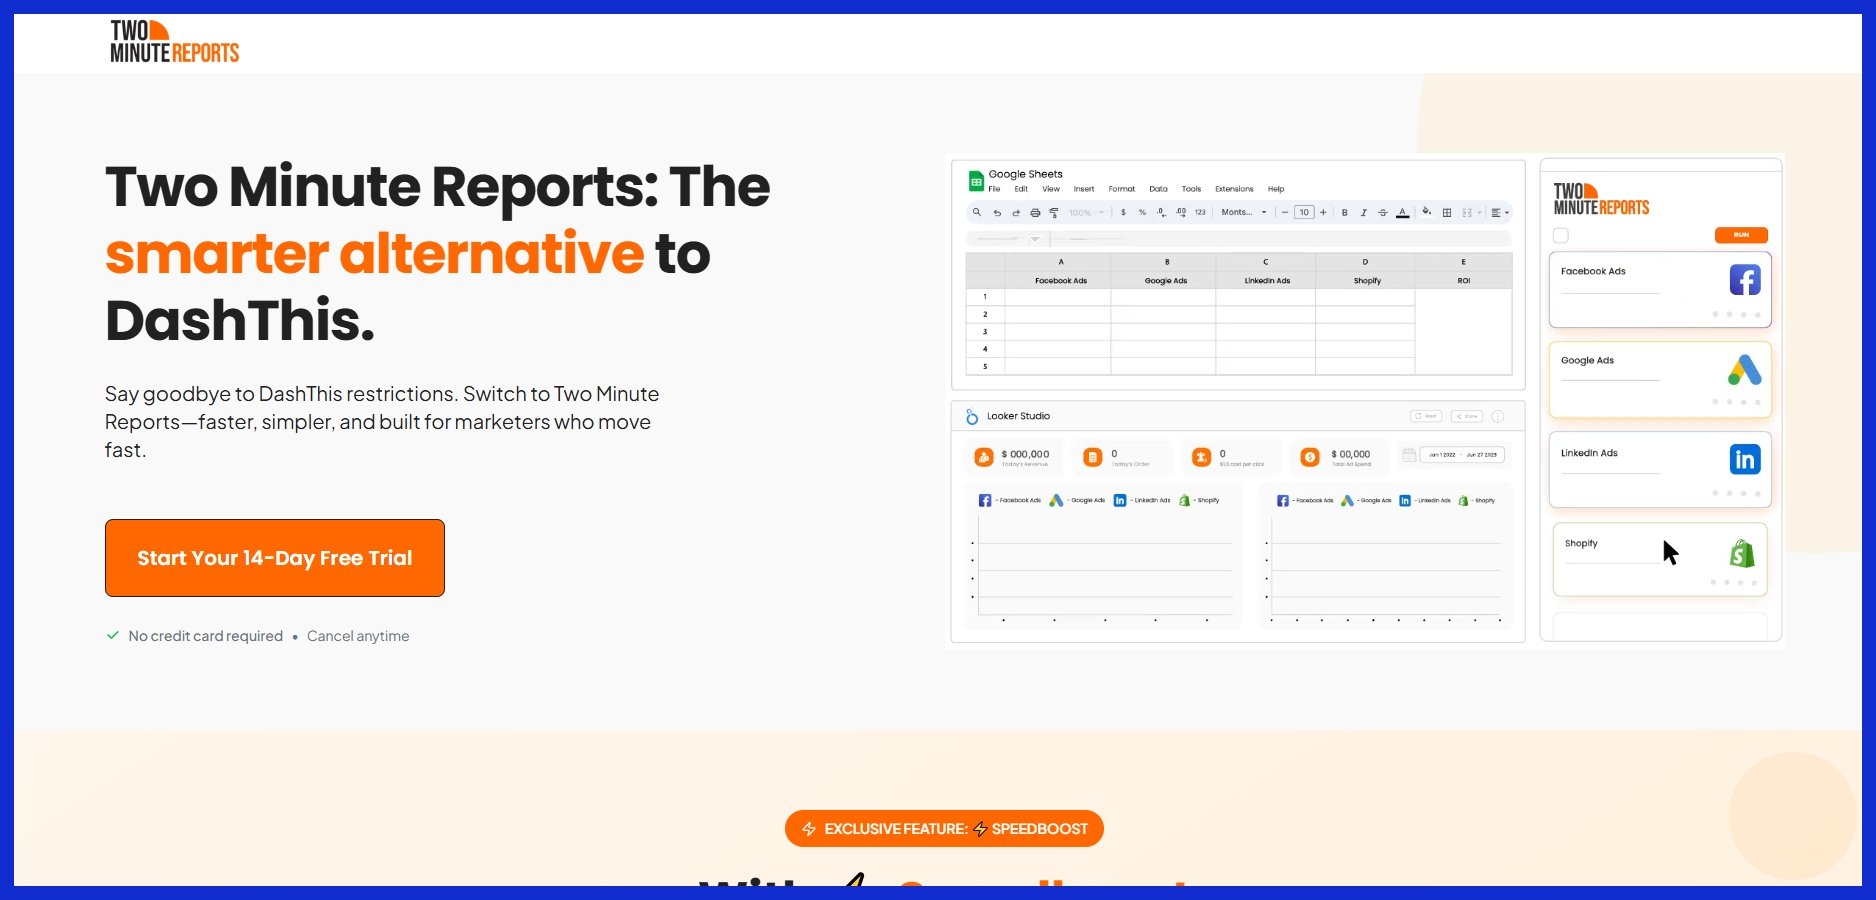
Best for: “Set it and forget it” reporting with clean templates.
What it does: Pre-built SEO report templates; plug in GA, GSC, Ahrefs, Moz, and more to auto-generate client-friendly dashboards and PDFs.
Pros: Very easy to use, good-looking out of the box, unlimited data sources on plans, automated email reports, and basic white-labeling.
Cons: Less flexible for deep customization or custom formulas; full white-label (custom domain) on higher plans.
Pricing: Entry plan in the lower double-digits per month; free trial available.
5. Swydo
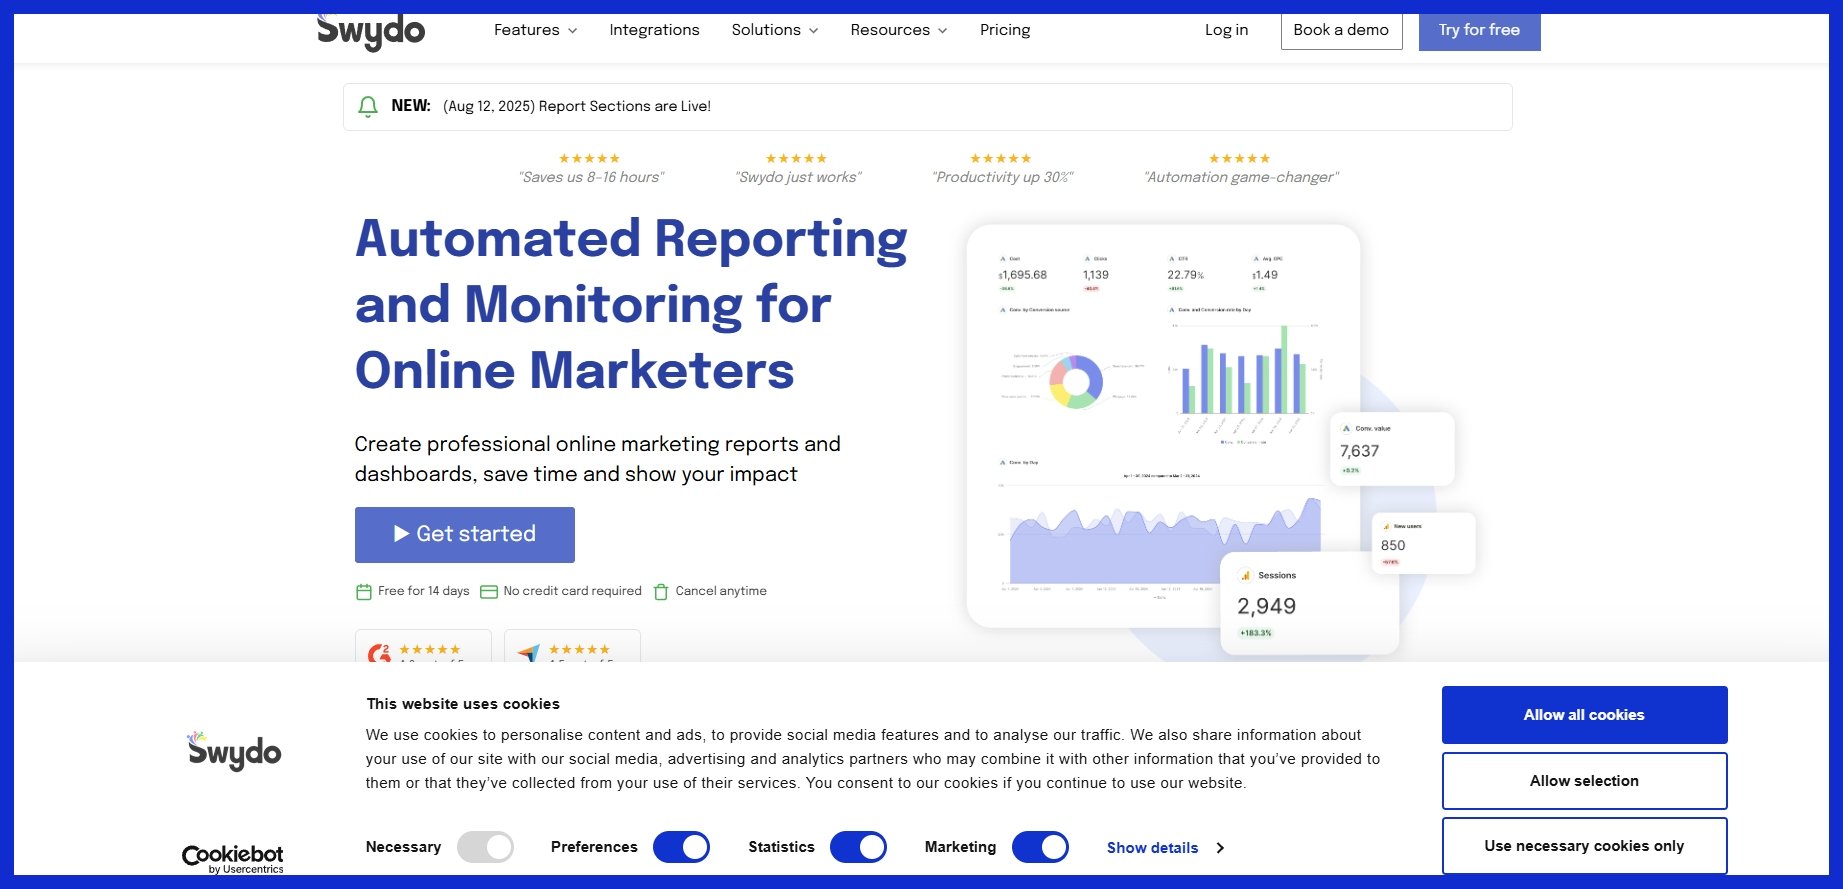
Best for: Automated, scheduled SEO/PPC reports with KPI alerts.
What it does: Combines GA, GSC, Ads, Facebook, and more into templated reports; schedules delivery and sends alerts when KPIs move.
Pros: Very client-friendly layouts, unlimited users/reports, solid automation and white-label options.
Cons: Pricing is based on number of data sources; very custom visualizations are limited compared to BI tools.
Pricing: Starts in the ~$50/month range; free trial available.
6. Reporting Ninja
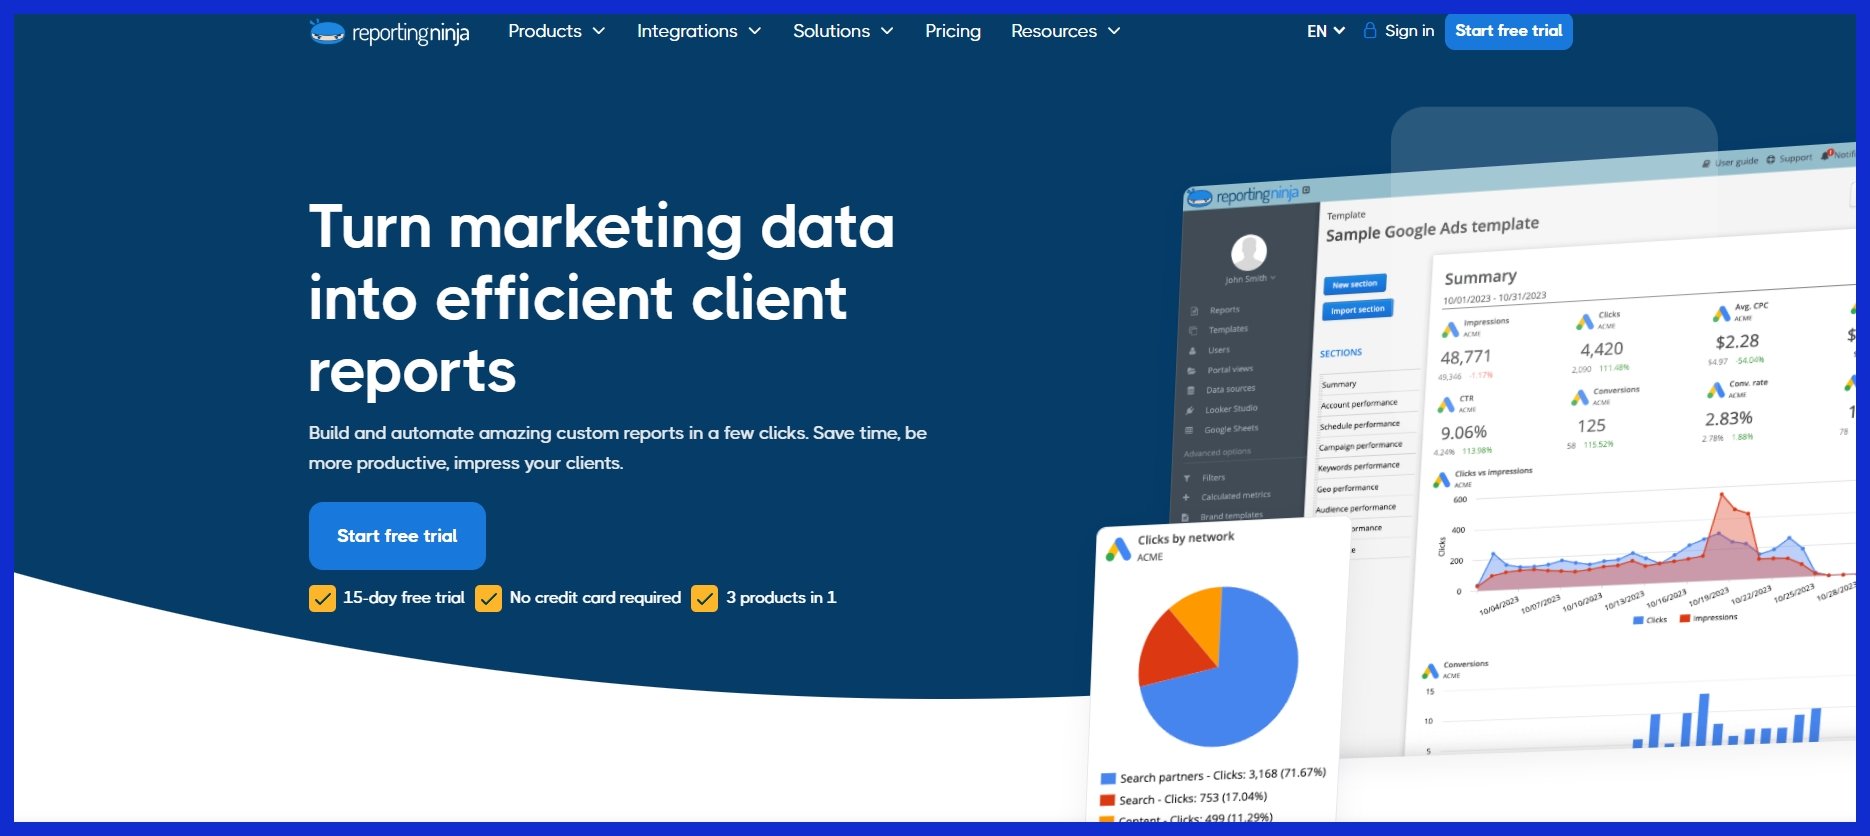
Best for: Custom, budget-friendly reports without losing features.
What it does: Drag-and-drop report builder pulling from GA, GSC, Ads, Bing, and others; white-label and scheduling included.
Pros: Excellent value, straightforward pricing, broad integrations, fast to brand and deliver.
Cons: No permanent free tier; fewer “smart” insights (you interpret the data); smaller community than big names.
Pricing: Starts around $20/month; higher tiers raise report/user limits.
7. Raven Tools

Best for: All-in-one SEO suite plus reporting.
What it does: Keyword research, rank tracking, site audits, backlinks—then wraps it all into customizable reports alongside GA/GSC and other sources.
Pros: Deep SEO toolkit in one place, white-label reporting, multi-source reports, good automation.
Cons: Interface can feel dense to newcomers; some datasets are less robust than specialist tools; broader marketing integrations exist but aren’t its main focus.
Pricing: Small-business plan in the sub-$50/month range; larger plans scale by number of sites/users.
8. SE Ranking
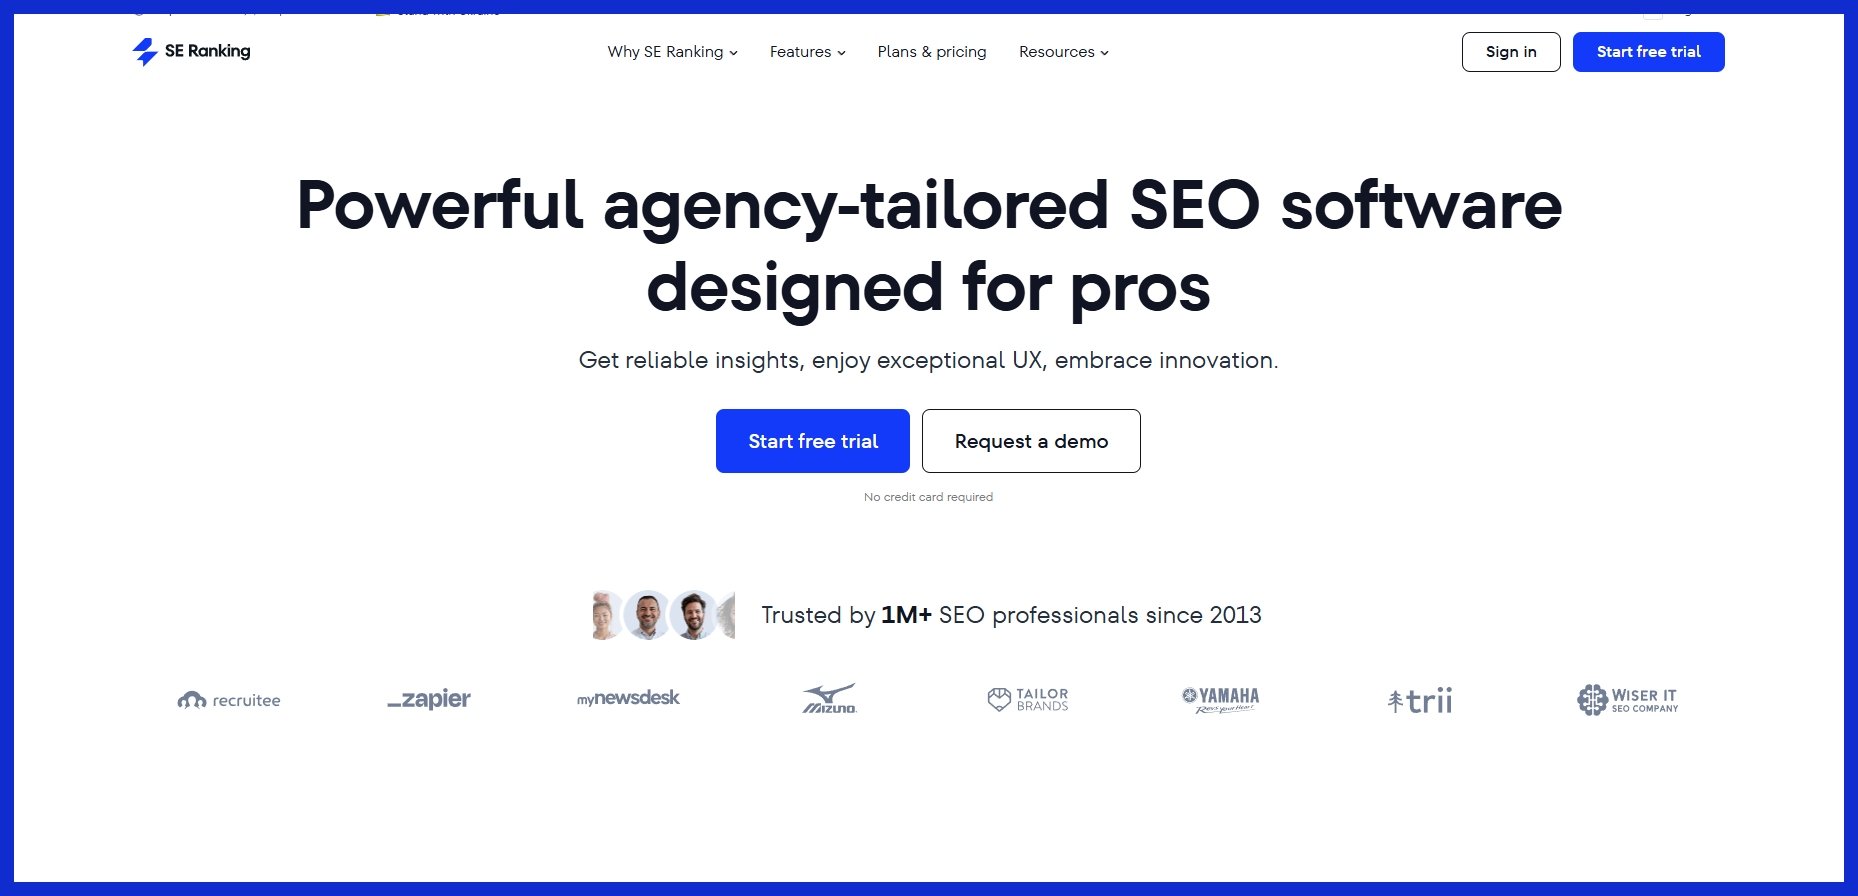
Best for: Affordable all-in-one SEO with built-in reporting.
What it does: Rank tracking, audits, keyword and competitor research, backlink monitoring, plus report builder and client access.
Pros: Strong value for money, easy scheduling, optional white-label, good for replacing multiple tools.
Cons: Primarily SEO-focused; limited native pull from non-SEO channels beyond GA.
Pricing: Typically from ~$39 to ~$65/month, depending on limits and billing; free trial available.
9. Cyfe
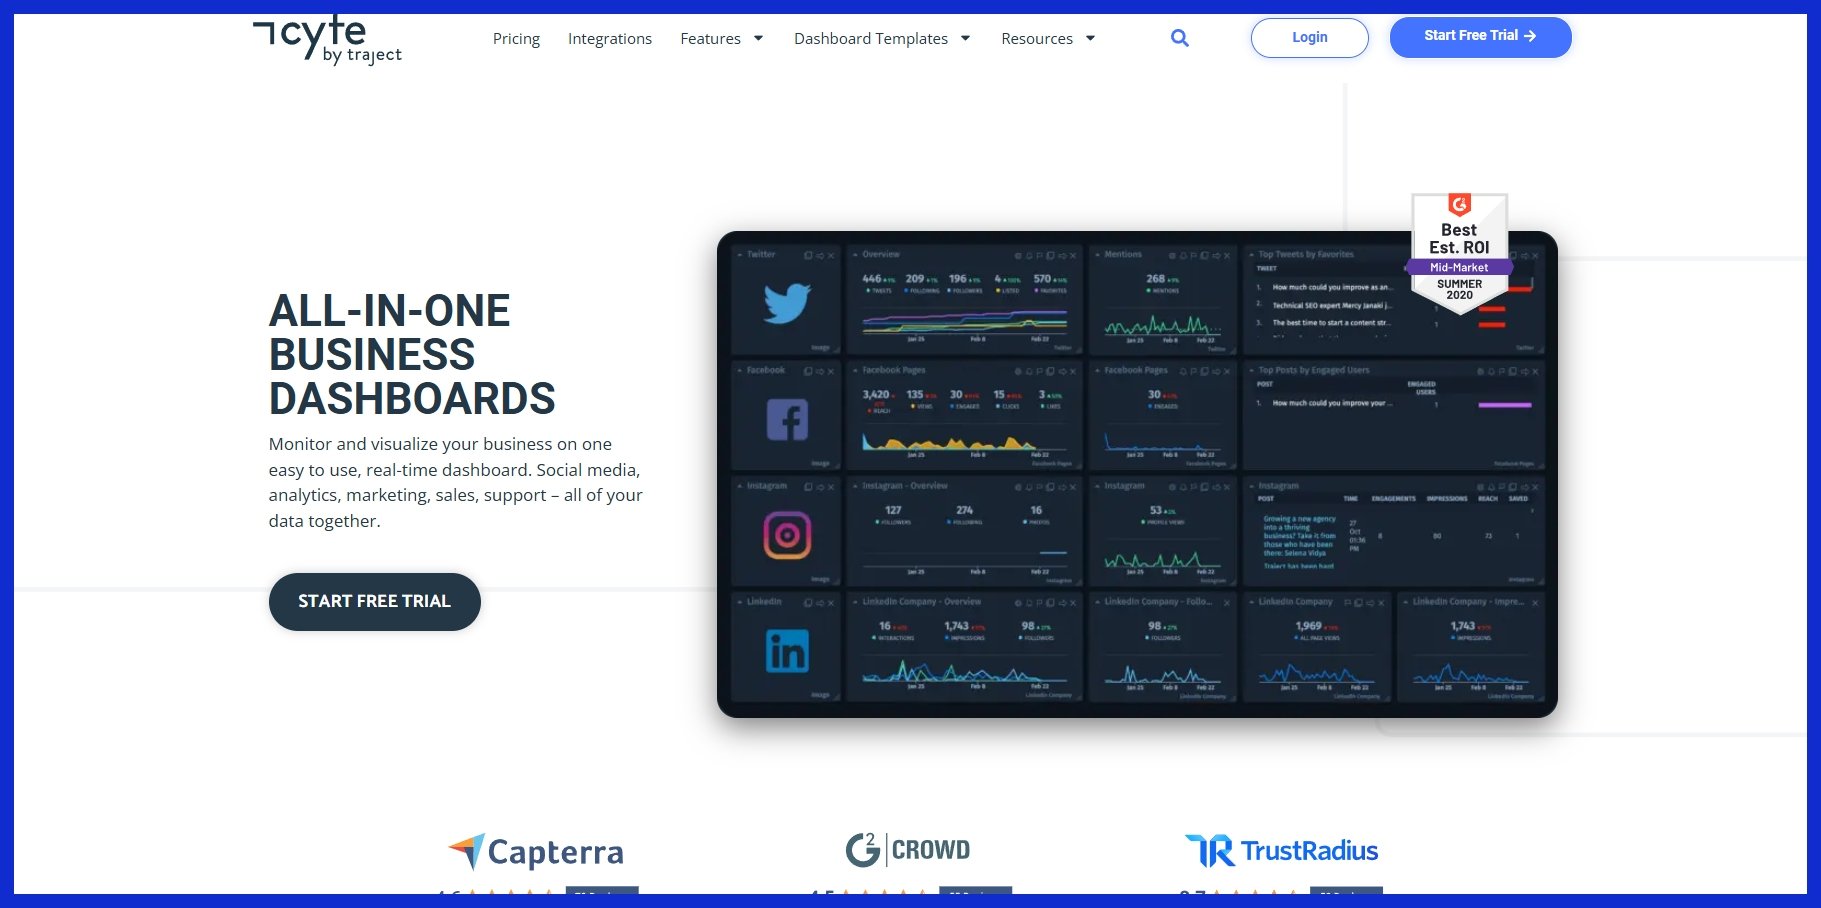
Best for: Simple, all-in-one business dashboards on a tight budget.
What it does: Monitors SEO, analytics, social, email, and sales KPIs with pre-built widgets (including GA and GSC).
Pros: Very affordable, quick setup, broad “single-pane” visibility, unlimited dashboards/users on higher plans.
Cons: Basic widgets and styling; lighter customization; interface feels dated to some users.
Pricing: Entry tiers in the ~$20–$30/month range; higher tiers for agencies with white-label options.
10. Geckoboard
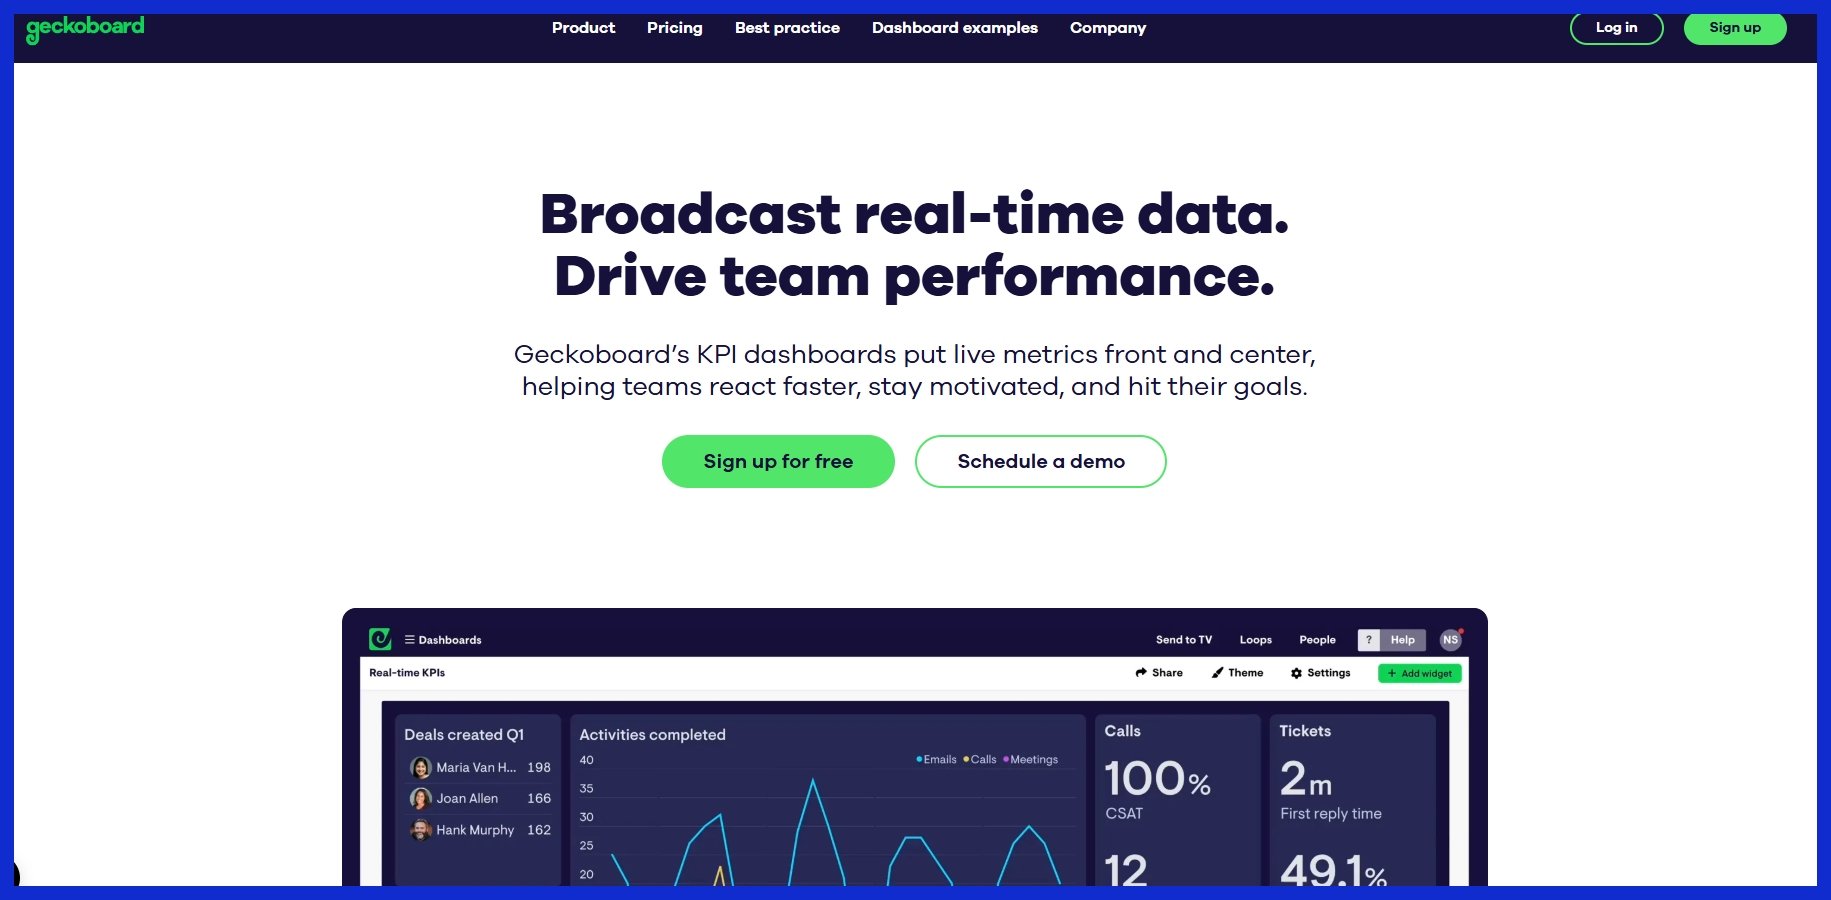
Best for: Real-time, TV-ready KPI screens for teams.
What it does: Live dashboards for GA and other sources (or custom data via Sheets) with clear, at-a-glance visuals.
Pros: Real-time updates, very simple to build and display, great for everyday visibility.
Cons: Not ideal for multi-page client PDFs or heavy analysis; customization and widget variety are intentionally lightweight.
Pricing: Starts in the ~$40s/month for a single live dashboard; higher plans add more dashboards/users.
Why Dashboards Matter
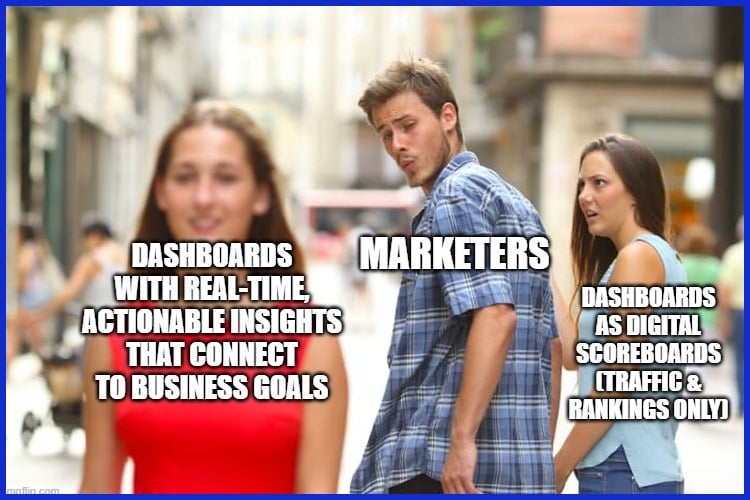
SEO reporting dashboards are so much more than digital scoreboards for organic traffic or keyword rankings. Their real worth is in reducing sprawling, complex marketing data into focused, actionable insights that power smarter decisions. For teams managing several SEO campaigns, dashboards provide a centralized, real-time view of results, bridging the gap between disparate data and the business goals that count.
When designed well, these dashboards become the bridge between your strivings and tangible results, driving momentum without requiring additional inputs.
Beyond Data
Raw numbers don’t drive action—stories do. SEO metrics only matter when paired with context. Visuals like trend lines, pie charts, and funnels turn data into clear stories that show why a traffic spike matters or how ranking drops affect revenue.
For example, a jump in sessions makes more sense when linked to a new content launch or a Google update. Strong dashboards connect data to business goals, showing how clicks lead to signups or sales.
Different audiences need different stories. Executives want the big picture—“Did we hit our targets?” Practitioners need the details—“What’s driving results, and where can we improve?”
Strategic Clarity
Without this, even the shiniest visualizations fall flat. Backlink growth only matters, for instance, if it’s correlated with being seen in valuable markets. With dashboards, teams track progress in real time, immediately identifying what’s effective and what requires focus.
Dashboards ensure everyone—from SEO strategists to content creators—reads from the same playbook. When everyone understands the implications of a drop in organic reach or a spike in branded search, the team acts faster and smarter.
A unified dashboard framework lets you evaluate strategy effectiveness, making it easy to pivot when trends shift or priorities change.
Time Efficiency
Manual reporting is a time sink — automated dashboards cure that. When you pull in real-time data from analytics, search consoles, and CRM tools, dashboards cut hours out of reporting cycles. That translates into less time wrangling spreadsheets and more time optimizing campaigns.
Real-time updates keep stakeholders informed, minimizing panicky catch-up meetings. With custom views, executives see high-level ROI while analysts dig into granular trends. By emphasizing only the most essential metrics, dashboards eschew information overload, providing teams with clarity, not confusion.
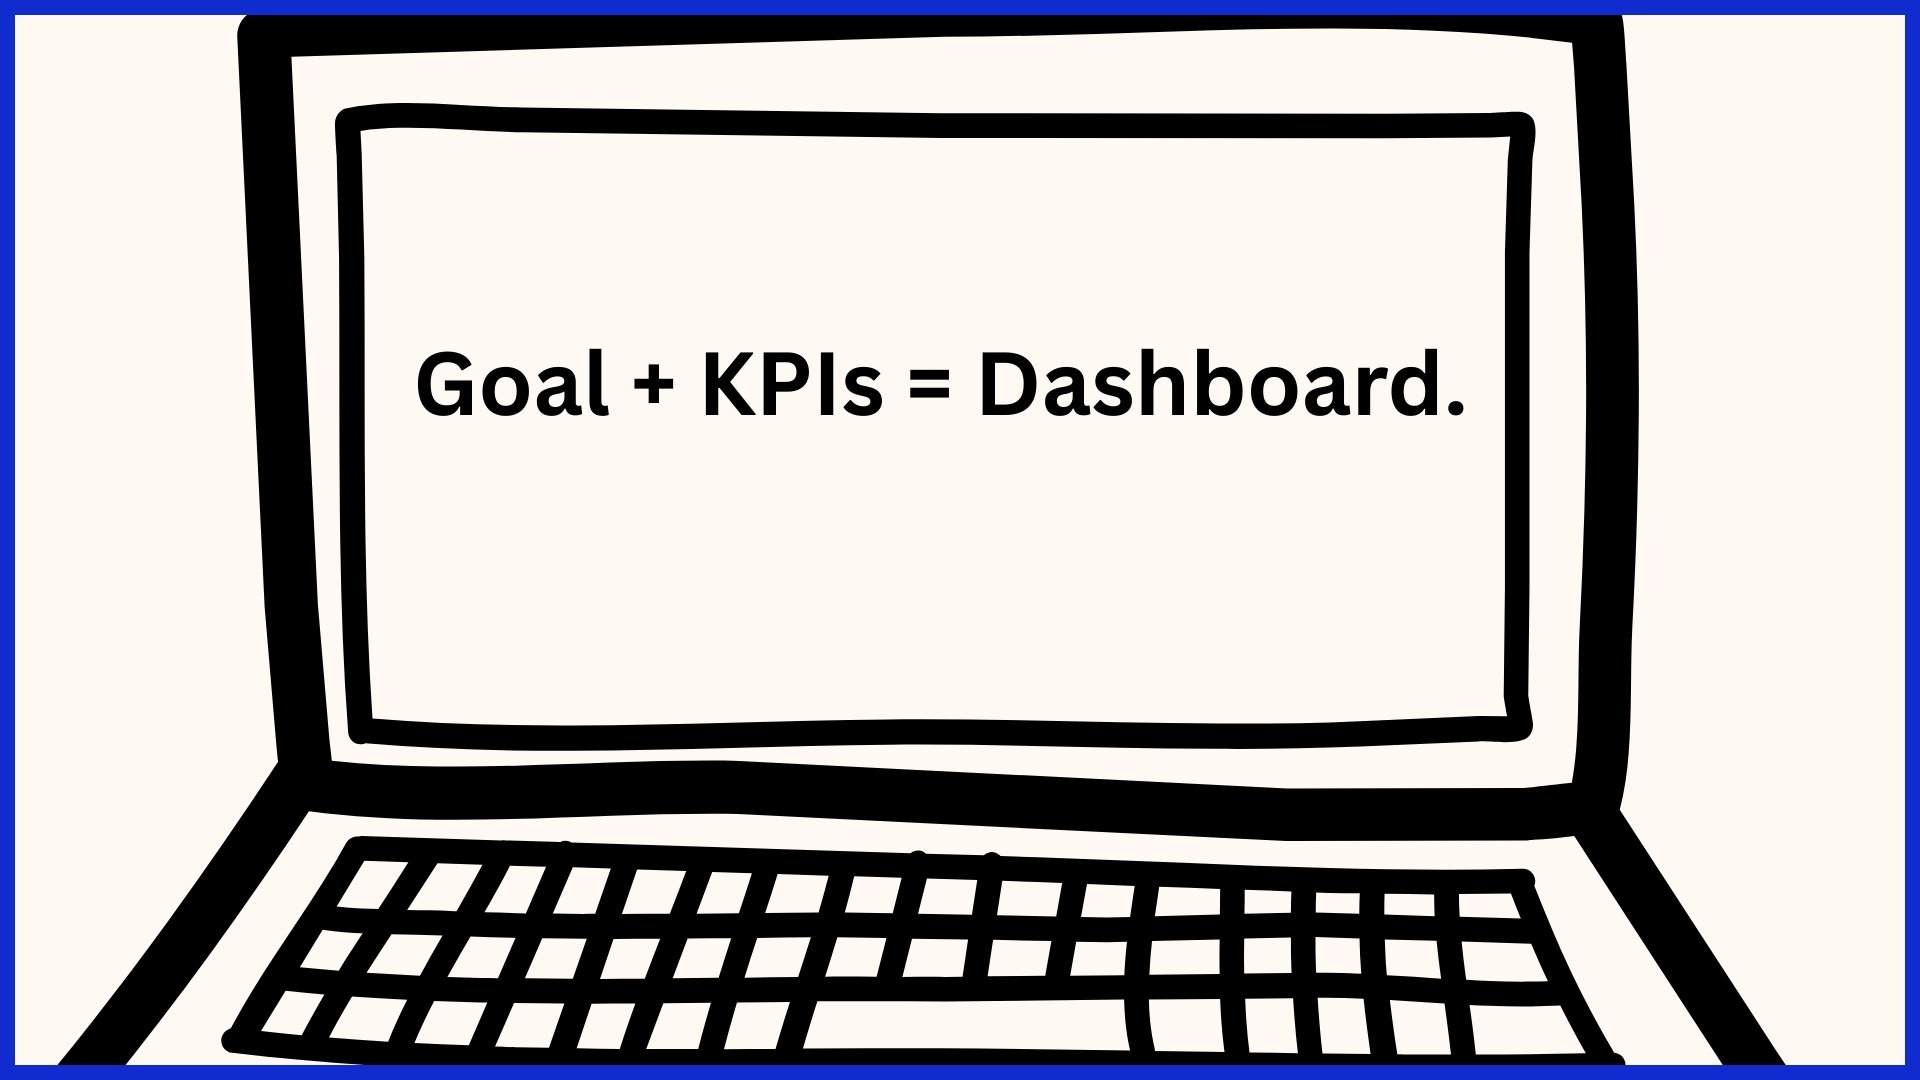
Designing Your Dashboard
A great SEO dashboard isn’t about cramming in every metric—it’s about clarity. Keep it simple with a clean layout and focus on no more than 8–9 key metrics. This way, users get quick, meaningful insights without drowning in numbers.
Consistent colors, branded elements, and drag-and-drop tools make dashboards look professional and easy to set up. Always align with the client’s brand—when the dashboard feels like an extension of their business, it adds real value, much like a data analysis presentation
that turns complex information into clear insights for stakeholders.
Visual Storytelling
Numbers alone don’t tell the story. Charts, line graphs, and bar diagrams make patterns obvious and keep both SEO teams and executives engaged.
-
Use colors and icons to highlight what matters (e.g., blue for traffic spikes, amber for dips in conversions).
-
Organize the flow: start with high-level traffic stats, move to backlinks, and end with conversions to guide even non-technical readers.
-
Experiment with heatmaps or interactive visuals to find what best conveys the story.
Audience Focus
Different stakeholders want different levels of detail. Executives care about KPIs and high-level trends, while SEOs need keyword rankings, crawl errors, and backlinks. One dashboard rarely fits all.
Check in regularly to see if the dashboard is still serving its purpose. Use plain language for general audiences and layer detail logically—top-level stats first, with the option to expand for deeper insights. This way, everyone finds what they need without extra clutter.
Interactive Elements
Dashboards shine when they’re interactive. Filters and drill-downs let each user explore at their own pace—whether that’s a manager looking at last month’s numbers or an SEO diving into mobile performance for a single page.
Interactivity reveals the why behind the what (like which backlinks caused a spike). Features such as saving views or duplicating pages add flexibility, ensuring the dashboard grows with changing business needs.
Integrating Multiple Data Sources
So, integrating multiple data sources in SEO reporting dashboards is more than just about collecting figures. It’s how you view the entire narrative. When you integrate metrics from various sources such as Google Analytics, SEMrush, and Search Console, you begin to discover trends that one source alone can’t reveal.
This strategy doesn’t merely add granularity; it provides your team with an actual advantage, simplifying the task of recognizing what’s effective and what to amplify. Below is a quick comparison showing how each source brings something different to the table:
|
Data Source |
Key Metrics Provided |
Main Contribution |
|---|---|---|
|
Google Analytics |
Sessions, bounce rate, goals |
Tracks visitor behavior and conversions |
|
SEMrush |
Keyword rankings, backlinks |
SEO health, competitive landscape |
|
Google Search Console |
Clicks, impressions, CTR |
Organic search performance, query data |
|
Social Media Insights |
Engagement, shares, followers |
Social visibility, brand awareness |
|
Paid Ads Platforms |
CPC, impressions, conversions |
Campaign ROI, ad spend efficiency |
APIs might sound technical, but they save hours each month. By connecting tools like Google Analytics or SEMrush directly to your dashboard, you skip the hassle of downloading reports or juggling spreadsheets.
With real-time syncing, your metrics are always up to date—sessions from Google Analytics and keyword rankings from SEMrush can sit side by side without any copy-paste work.
The key is consistency. If one source calls sessions “visits” and another calls them “users,” your numbers won’t match. Standardizing terms and time zones keeps data accurate and trustworthy. Larger teams often set clear guidelines or even run scripts to clean data before it hits the dashboard.
The result is a centralized view of everything—SEO, content, PPC, and social—all in one place. Each person gets the metrics they need without chasing multiple reports.
That said, it’s not always plug-and-play. Free plans may limit how many sources you connect, and sometimes native integrations aren’t enough. In those cases, you may need extra tools or custom setups to get the full picture.
Beyond Basic Reporting
Advanced SEO dashboards go further than counting rankings or traffic. They bring data together from multiple sources—analytics, search console, backlinks—so you see the full picture.
Numbers alone don’t help. Dashboards should add context: compare month-over-month, year-over-year, or against competitors. This way, you spot real trends, seasonal shifts, and unusual changes.
The best dashboards track details like keyword movement, ranking spread, featured snippets, user behavior, and conversions. Most importantly, they turn data into insights and recommendations—otherwise, it’s just numbers on a screen.
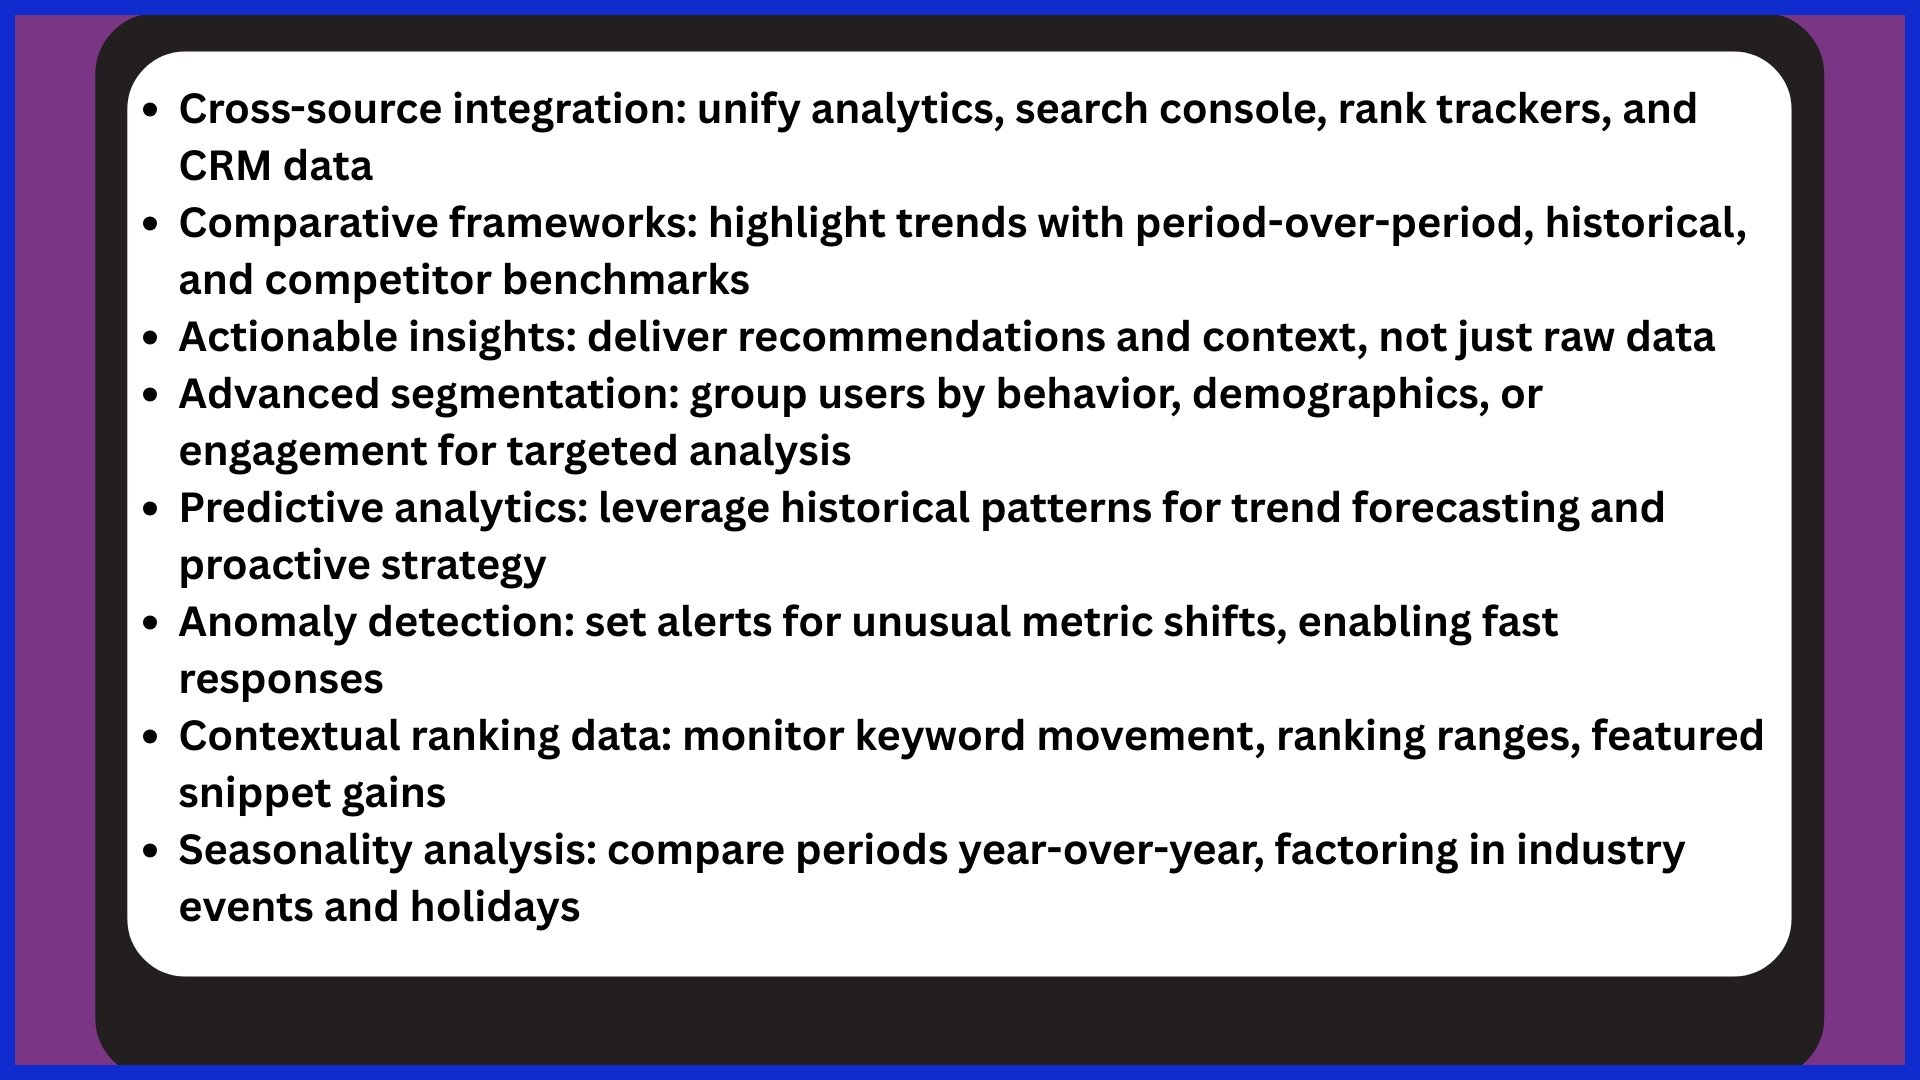
Predictive Analytics
Predictive analytics converts historical SEO data into foresight. By studying years of keyword movement, traffic, and conversion events, these tools can predict trends such as which keywords are likely to surge in the next quarter or when a rival’s gains are likely to become your losses.
Machine learning algorithms bring accuracy, learning from previous fluctuations, campaign impacts, and even seasonality blips. Trustworthy predictions let teams schedule content calendars, technical fixes, or link-building pushes ahead of shifts.
By sharing these projections with stakeholders, everyone can get on the same page about what’s reasonable to expect and prepare for what’s ahead, not just respond to what has already occurred.
Anomaly Detection
Dashboards with anomaly detection flag sudden spikes or drops that don’t fit established patterns. Automated alerts are sent when, say, organic traffic tanks overnight or conversion spikes.
These notifications demand a deeper inspection—is it a Google update, or a technical glitch, or what? Fast anomaly analysis tells you if it’s a real chance or something to be patched up.
After all, at times, repeated anomalies are, in fact, the initial indication of a fresh trend—be it a search engine algorithm adjustment or nascent user interest. Consistent check-ins guarantee that there’s no falling through the cracks, and that teams can react before minor mistakes turn major.
Conclusion
SEO reporting dashboards aren’t just about numbers—they tell the story of your website’s journey. Done right, they highlight wins, catch issues early, and give every metric context. By bringing data together from multiple sources, you see the full picture—not just top-line stats.
A clear, well-designed dashboard keeps teams focused on what truly drives growth, rather than vanity metrics. The best ones are built with final goals in mind but flexible enough to adapt as strategies shift. Whether you’re in-house or agency-side, a strong dashboard transforms raw data into actionable insights—making your next move clearer.
For marketers who want to go beyond the basics, tools and strategies from platforms like SERPninja can help turn those insights into real-world SEO wins.
Frequently Asked Questions
What is an SEO reporting dashboard?
SEO reporting dashboards are effective dashboard tools that visually monitor key SEO metrics, assisting teams in rapidly visualizing website performance and making informed decisions based on valuable insights.
Which metrics should be included in an SEO dashboard?
Essentials such as organic traffic, keyword rankings, and important metrics like click-through rate and bounce rate are crucial for an effective SEO analytics dashboard.
How do I integrate multiple data sources into my SEO dashboard?
Turn to effective dashboard tools that support Google Analytics, Search Console, and backlink tool integrations. Using an seo analytics dashboard guarantees you view all vital data in a single location.
What are the benefits of using an SEO dashboard?
Dashboards save time and enhance reporting accuracy, enabling quicker identification of trends. They simplify sharing insights with stakeholders and adapting strategies using effective dashboard tools.
What mistakes should be avoided when creating SEO dashboards?
Don’t jam your seo analytics dashboard with too many metrics. Concentrate on key performance indicators, maintain a minimalist design, and utilize trustworthy and current data feeds.
Can SEO dashboards be customized for different stakeholders?
Absolutely, dashboards can be audience-specific as well. For instance, managers may desire high-level summaries in their seo analytics dashboard, while specialists require granular data to inform their optimization efforts.
How often should SEO dashboards be updated?
Refresh your seo analytics dashboard on a daily or weekly basis. By delivering frequent updates, decisions are made on current data, enabling teams to respond rapidly to performance fluctuations.


